H1 2025 Bio/Pharma Funding Trends Report
- Jul 24, 2025
- 5 min read
Updated: Jul 29, 2025
“Bio/pharma funding deal data in H1 2025 reveals a troubling downward shift starting in February.”
Investment in bio/pharma was down in H1 2025 according to data from the BiopharmIQ database¹. From the total first half data, this was most apparent in data related to public companies. However, more troubling were the downward trends in bio/pharma investment seen as 2025 progressed. Q2 2025 had the lowest private and post-IPO public funding activity of any quarter since Q1 2024. And private bio/pharma funding showed a troubling monthly downward shift starting in February 2025, and an even deeper drop-off in June.
This post provides details regarding this macro bio/pharma funding data for H1 2025. You can also check out the free H1 2025 Bio/Pharma Funding Report, sponsored by Double Helix Law, that was generated using the BiopharmIQ platform (Download it from here). This Report provides a big picture of companies and technology areas that were funded to help sales, marketing, and business development professionals identify target bio/pharma companies and sectors.
H1 2025 Funding Activity
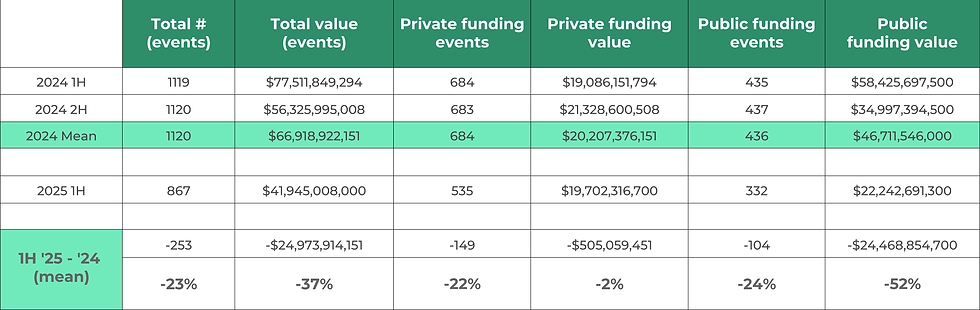
Bio/pharma funding and investment were down in the first half of 2025. This was apparent in the public markets with IBB down 4.3% and XBI, which represents more smid-cap bio/pharma influence, down 7.9%. Furthermore, when comparing funding events in the 1st half of 2025 compared to the 1st or 2nd half of 2024, the drop is apparent (Table 1). For post-IPO public company funding, the drop is apparent in the number of events (-24%) and the total value of events (-52%). For private company funding, looking at the 1st half of 2025 as a whole, although the value of deals was down only 2% ($20.2B vs. $19.7B) from the mean of the 1st and 2nd half of 2024, the total value of deals was down by 22%.
Table 1. Funding activity: 1st half 2025 compared to 2024
The more troubling trend with respect to the downturn in biotech funding across public and private funding in the 1st half of 2025 is revealed by a more detailed analysis. For example, quarterly trends reveal a decrease in funding in both public post-IPO and private companies in Q2 2025 (FIG.1).
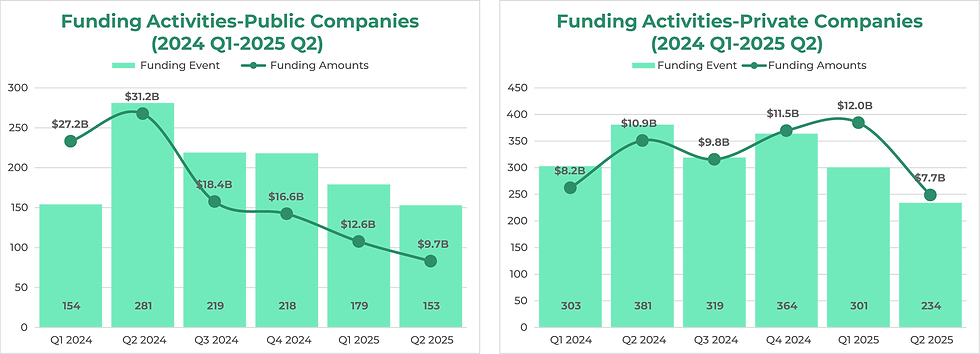
Q2 2025 had the lowest number of public and especially private funding events (FIG. 1). Furthermore, Q2 2025 saw a dramatic decrease in the total value of funding: down to $9.7B in post-IPO public company funding, and $7.7B in private company funding. Those were the lowest totals of any of the quarters since the start of 2024 (FIG. 1). Furthermore, with respect to private funding, Q2 2025 showed a particularly significant slowdown, dropping 35.3% quarter over quarter from Q1 2025, and 29.2% year-over-year.
The month-on-month numbers provide more insight into the H1 2025 downturn. Although January 2025 showed an uptick in private funding events and total amount, the sharpest month-on-month drop in 2025 occurred in February, when private funding fell more than 65% from January’s $6.27B to just $2.05B (FIG. 2). Funding remained at a low level for February through June 2025.

This shift down in funding starting in February 2025 is even more apparent by the fact that the number of private company funding events in February through June 2025 was lower than any month since January 2024 (FIG. 3). June 2025 showed the lowest number of private company funding events (69) and was the only month whose total private funding ($1.9B) did not reach $2.0 billion.

Funding Activity by Stage
Early-stage private deals (Series A and earlier) followed a similar downward pattern in H1 2025 as private funding overall. Although 205 early-stage deals (~38% of all deals) closed in H1 2025, including 100 Series A and 89 Seed rounds, the number of deals was lower than in H1 2024 or H2 2024, mainly because early-stage funding on a quarterly basis had a large drop in Q2 2025 (FIG. 4).

On a more detailed monthly basis, a steep drop-off in deals (FIG. 5A) and deal value (FIG. 5B) was observed starting in February 2025, in a pattern reflective of funding events overall and private funding events in particular, as discussed above. Notably, Q1 2025 recorded the highest early-stage deal volume and numbers across the last six quarters, from Q1 2024 through Q2 2025, reflecting a brief resurgence in investor risk appetite (FIG. 4). However, the uptick was mainly due to a resurgence in January 2025. The exuberance faded abruptly again in February 2025, continuing at this lower activity level until a steep drop-off in the number of deals in June 2025 (FIGs. 5A and 5B).


Concluding Remarks: Will the H1 bio/pharma funding downturn reverse in 2025?
In summary, bio/pharma funding activity was down in H1 2025, despite a brief surge in January 2025 in private deals overall, and early-stage deals in particular. The funding trends, when considered on a monthly basis, reveal that after the January surge in private deals, deal volume and total amount were down significantly, reaching their lowest point in June 2025, the last month of data, for private and especially early-stage deals.
The key question now for the bio/pharma industry and its investors is, when will this downturn in bio/pharma funding reverse? Is this downturn primarily driven by policies of the current U.S. administration? This would suggest tough years ahead for private bio/pharma. Or are there important factors at play that may change much sooner, catalyzing a much quicker reversal? For example, a significant uptick in the public smid-caps (e.g., the ETF XBI) or M&A activity could open up the bio/pharma IPO market, which could drive private funding regardless of other macro trends.
Fortunately, although numbers are down, many bio/pharma companies closed funding deals in the 1st half of 2025. What companies and bio/pharma technology areas closed funding deals? What lessons can be learned from these? These questions and more are the subject of a free H1 2025 Bio/Pharma Funding Report, sponsored by Double Helix Law, that was generated using the BiopharmIQ platform. The H1 2025 Bio/pharma Funding Report provides a big picture of the companies that were funded. This information will help sales, marketing, and business development professionals identify target bio/pharma companies and sectors. Furthermore, the information in this Report will be helpful to senior leaders and finance executives of bio/pharma companies who have attempted to raise money in H1 2025 and/or are looking to raise money in the coming months.
Article History:
7/25/25 MV - Revised 7/29/25 MD
Not legal, investing, or tax advice.


I was diagnosed with Parkinson’s disease four years ago. For over two years, I relied on prescription medications and therapies, but unfortunately, the symptoms continued to worsen. My mobility declined, tremors increased, and I experienced growing fatigue and discomfort that affected my daily life. Last year, out of desperation and hope, I decided to try an herbal treatment program from NaturePath Herbal Clinic. Honestly, I was skeptical at first, but within a few months of starting the treatment, I began to notice real changes. My energy improved, the discomfort eased, and I felt stronger and more capable in my daily life. Incredibly, I also regained much of my stamina, balance, and confidence. It’s been a life-changing experience I feel more…